Deep vessel segmentation by learning graphical connectivity.
Published in Medical Image Analysis, 2019
Authors: Seung Yeon Shin, Soochahn Lee, Il Dong Yun, Kyoung Mu Lee
TL;DR: A deep learning method for vessel segmentation that learns graphical connectivity between vessel segments by combining CNN and GNN in an end-to-end structure to better model the topological structure of vascular networks.
What this paper is about
Standard pixel-wise segmentation methods often produce fragmented vessel maps with broken connections, which is a serious problem when the downstream task requires understanding the vascular network topology. Vessels form connected tree- or graph-like structures, and preserving that connectivity is essential for meaningful clinical analysis.
Key idea
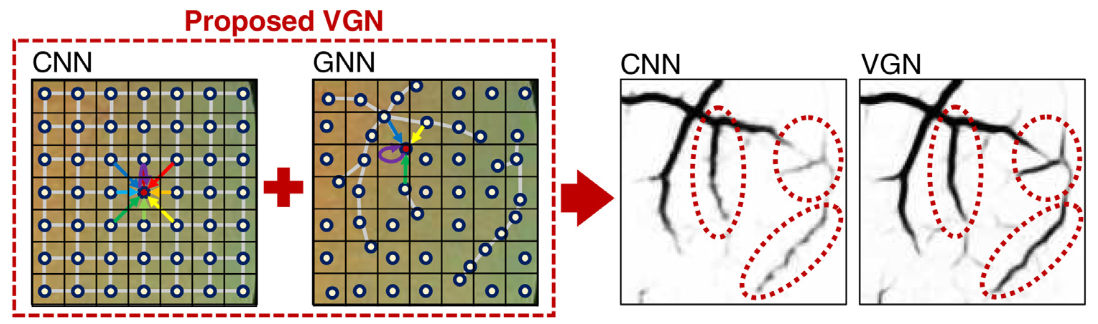 Motivation of the proposed method. The articulated shape and hierarchical patterns of the vessel structures are not likely to be learned in existing CNN-based vessel segmentation methods. The proposed vessel graph network (VGN) utilizes a graph neural network (GNN), to propagate information along vessel structures, together with a CNN to address this issue. In the presented example results, VGN clearly enhances the detection of vessels with weak contrast by considering the vessel graph structure, compared to that of a CNN-only method (Maninis et al., 2016). The resulting vessel probability images are inverted for better visualization. All figures best viewed in color.
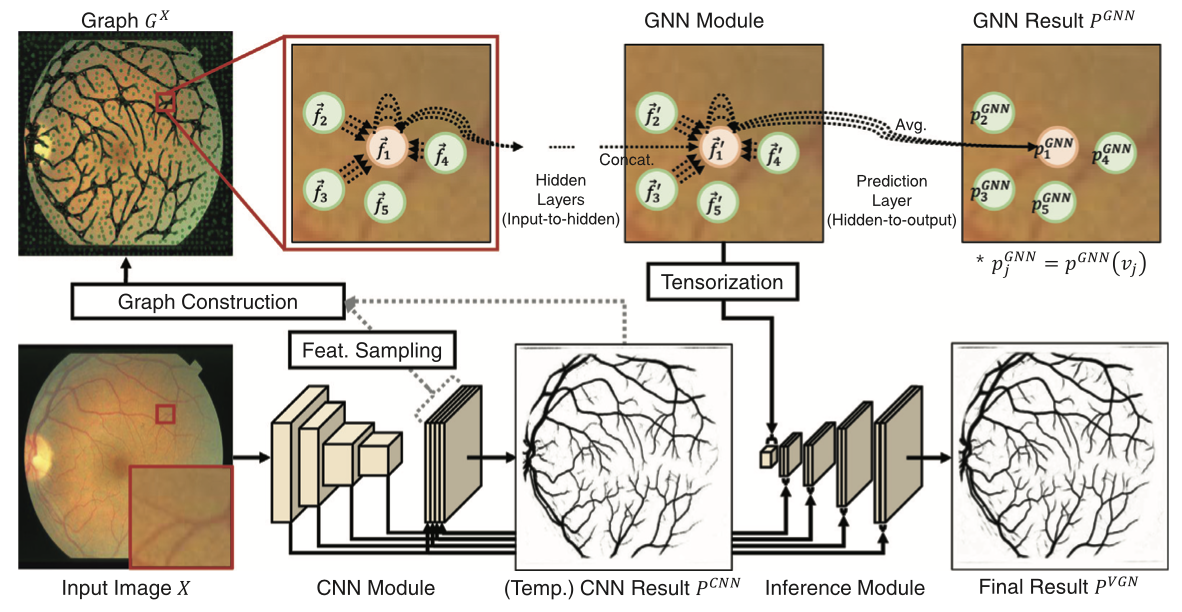 Overall network architecture of VGN comprising the CNN, GNN, and inference modules. The CNN module generates pixelwise features corresponding to vessel probabilities, whereas the GNN module generates features which reflect the vascular connectivity. $\overrightarrow{f}_j$ and⃗ $\overrightarrow{f}^{′}_j$ are the input and hidden representations of each vertex $v_j$, respectively, and $p^{GNN}(v_{j})$ is the corresponding vessel probability prediction in the GNN module. The CNN and GNN modules are respectively devised to extract local/global evidences for vessels. The CNN and GNN features are then complementarily combined in the inference module to produce the final vessel probability map. The input graph for the GNN is generated in a separate graph construction module. The resulting vessel probability images are inverted for better visualization. Refer to Fig. 3 for the detailed network design.
Rather than just classifying individual pixels, this method explicitly learns the graphical connectivity between vessel segments. By incorporating connectivity prediction into the deep network, the model produces segmentation results that maintain the structural integrity of the vascular graph, reducing fragmentation and topological errors.
Why it matters
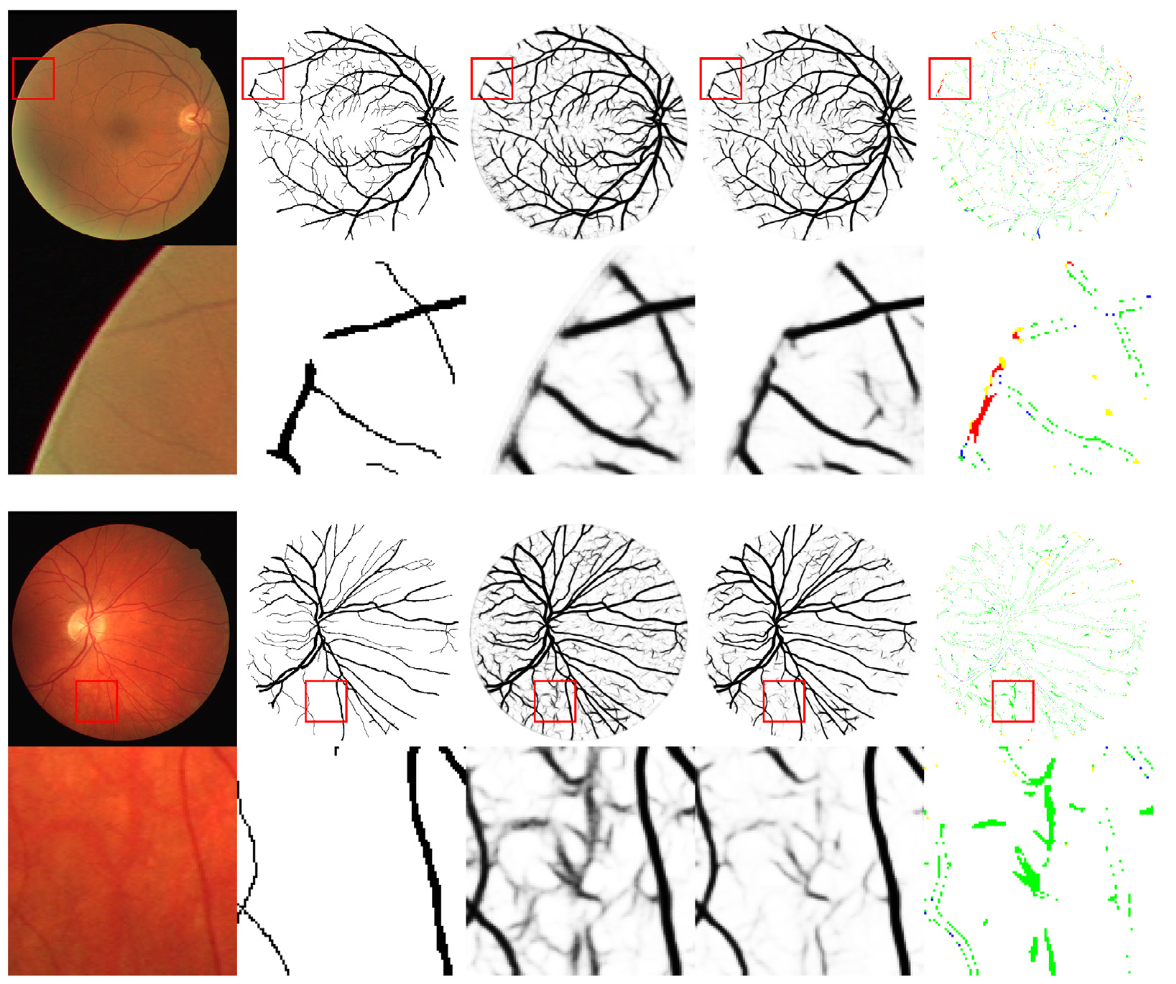 Each couple of rows represents qualitative results of two representative samples from the DRIVE dataset. The images in the first row from left to right are, the original input image, GT, result of DRIU∗ representing our own implementation of Maninis et al. (2016), result of VGN, and the highlighted difference between binarized vessel masks of DRIU∗ and VGN. Refer to Table 7 for color notation of the highlighted difference. The second row in each case is the corresponding zoomed images of the first row. The GT and vessel probability images are inverted for better visualization.
Published in Medical Image Analysis, this work addresses a fundamental limitation of pixel-wise segmentation for tubular structures. Maintaining vascular connectivity is critical for applications like blood flow simulation, surgical planning, and disease progression tracking.